Note
Go to the end to download the full example code. or to run this example in your browser via Binder
q. violin
This file shows the usage of violin_plot() function.
import numpy as np
import pandas as pd
import matplotlib.pyplot as plt

from easy_mpl import violin_plot
from easy_mpl.utils import _rescale
from easy_mpl.utils import version_info

version_info()
{'easy_mpl': '0.21.5', 'matplotlib': '3.9.4', 'numpy': '2.0.2', 'pandas': '2.2.3', 'scipy': '1.13.1'}
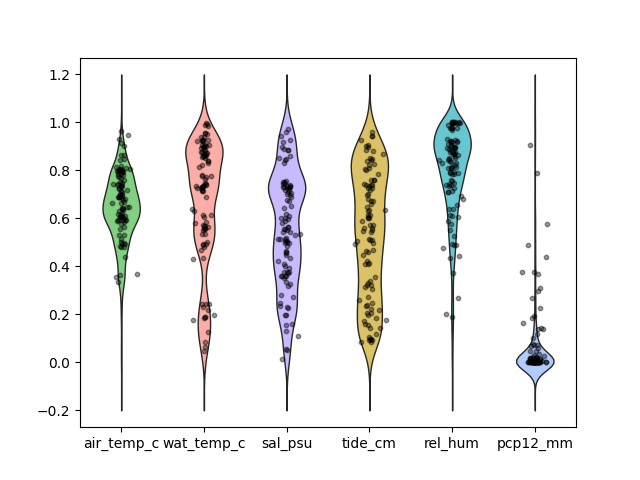
The basic violin plot can be drawn by passing a pandas DataFrame with one or more columns.
The function :func:`violin_plot always returns a matplotlib axes object.
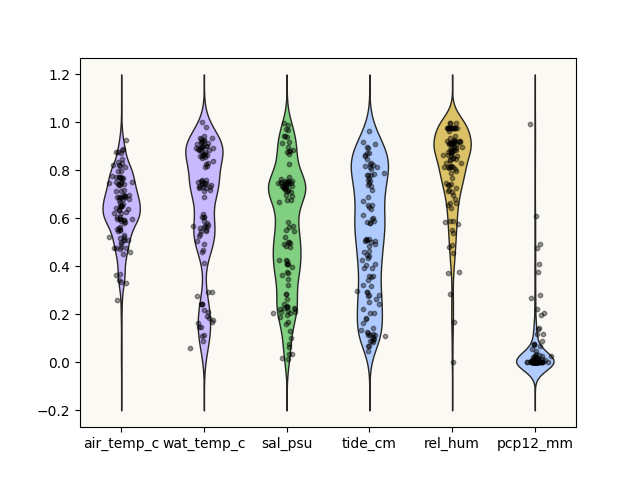
If we set show to False then, the returned axes can be used for further manipulation.
axes = violin_plot(df[cols], show=False)
axes.set_facecolor("#fbf9f4")
plt.show()
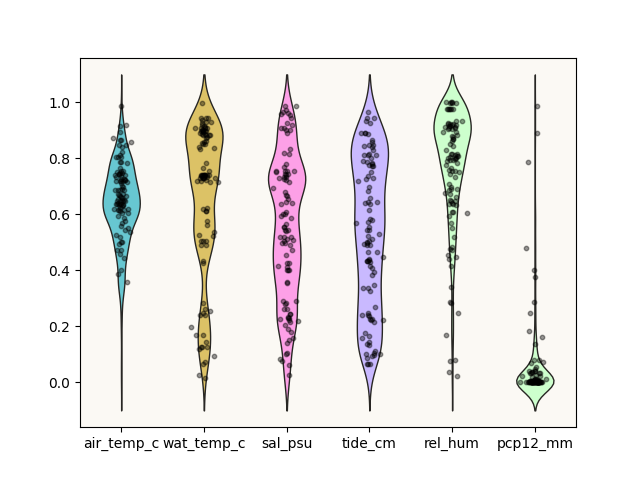
The value of cut determines the length of tails on both sides.
axes = violin_plot(df[cols], show=False, cut=0.1)
axes.set_facecolor("#fbf9f4")
plt.show()
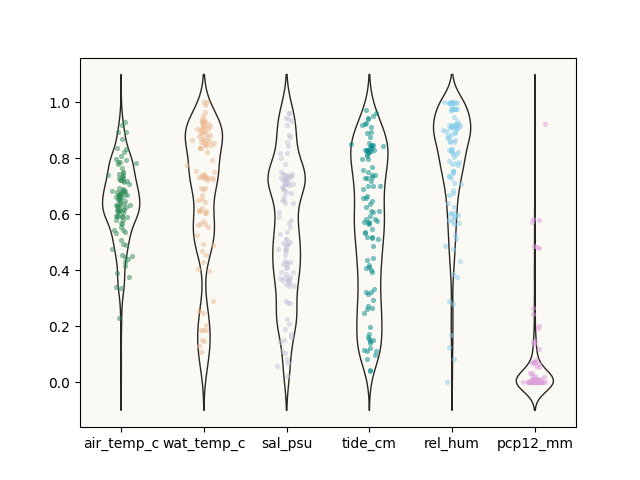
We can specify colors for each of the violin plot separately. It can be any valid matplotlib colors i.e., name of color as string or its RGB vlaue.
axes = violin_plot(
    df[cols], show=False, cut=0.1, fill=False,
    scatter_kws={"s": 12, 'alpha': 0.5, 'edgecolors': None, 'linewidths': 0.2},
    datapoints_colors=['seagreen',
                       np.array([237, 187, 147]) / 255,
                      np.array([197, 194, 218]) / 255,
                      'darkcyan',
                      'skyblue',
                      "plum",
                       ]
                   )
axes.set_facecolor("#fbf9f4")
plt.show()
Total running time of the script: (0 minutes 0.907 seconds)