Note
Go to the end to download the full example code. or to run this example in your browser via Binder
l. circular_bar_plot
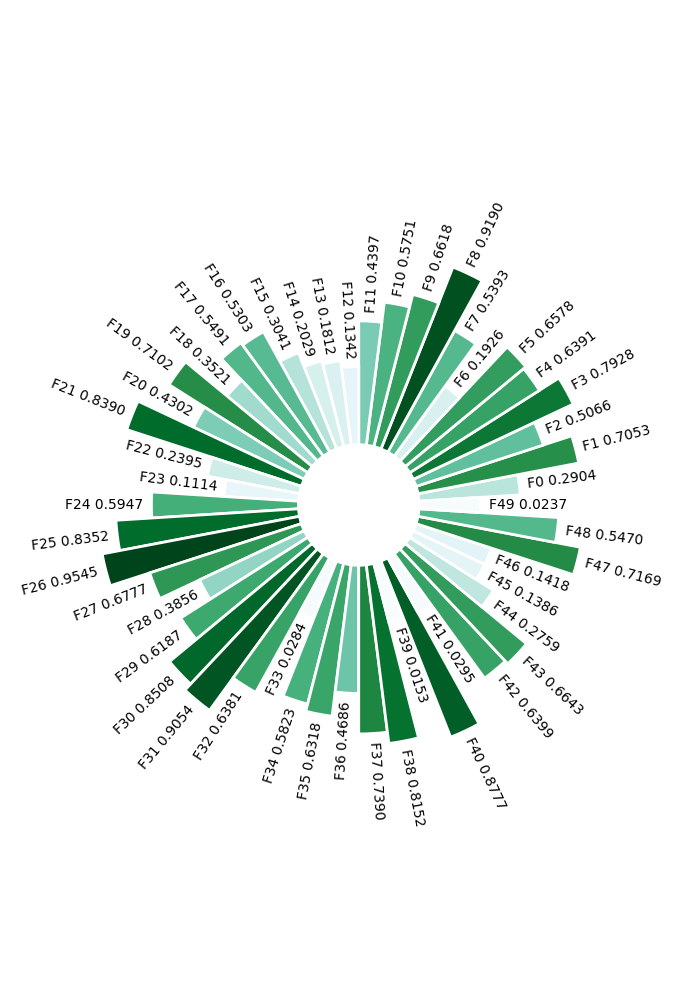
This file shows the usage of circular_bar_plot() function.
import numpy as np
from easy_mpl import circular_bar_plot
from easy_mpl.utils import version_info

version_info()
{'easy_mpl': '0.21.5', 'matplotlib': '3.9.4', 'numpy': '2.0.2', 'pandas': '2.2.3', 'scipy': '1.13.1'}
basic
data = np.random.random(50, )

_ = circular_bar_plot(data)
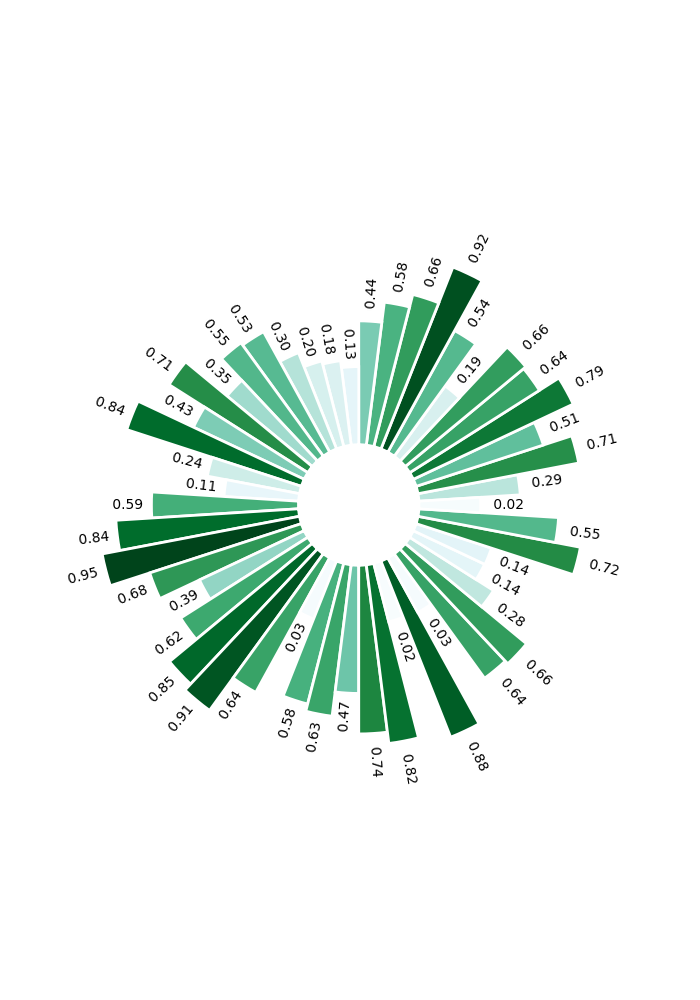
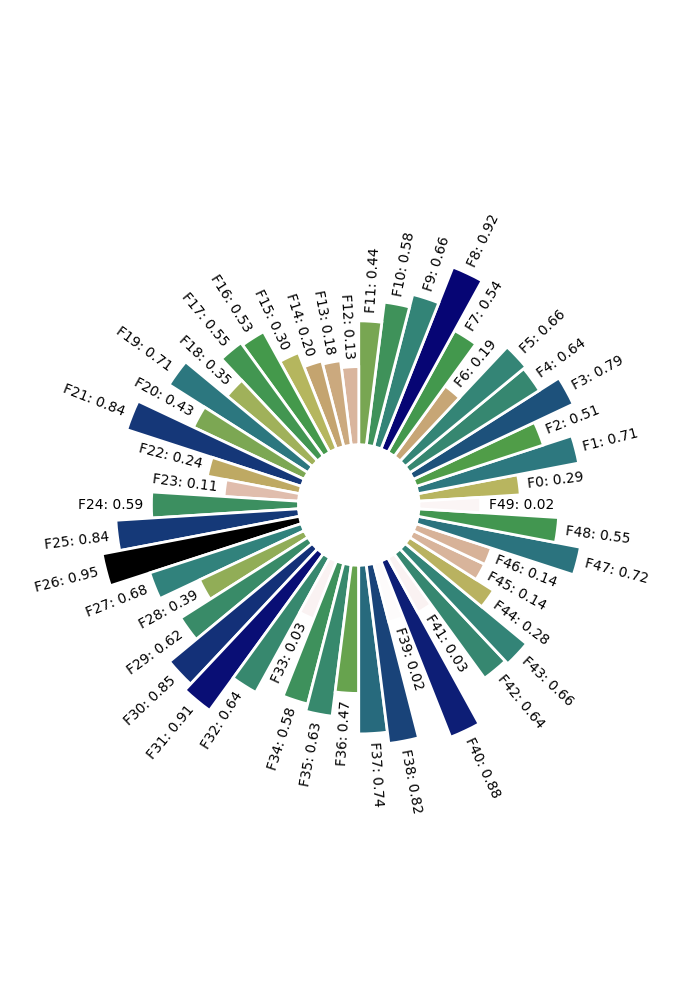
with names
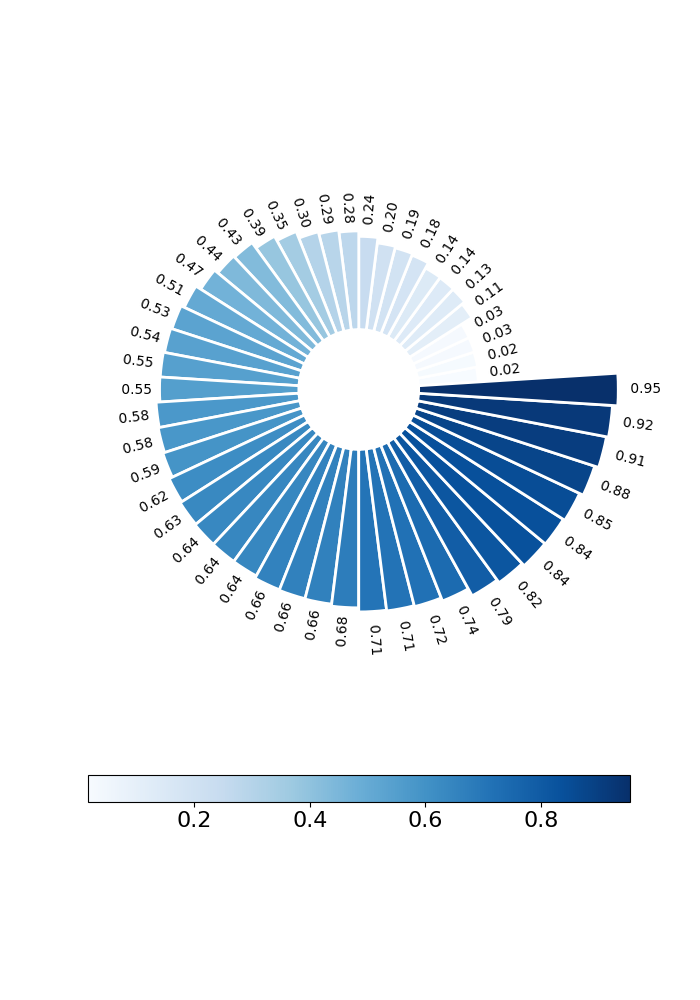
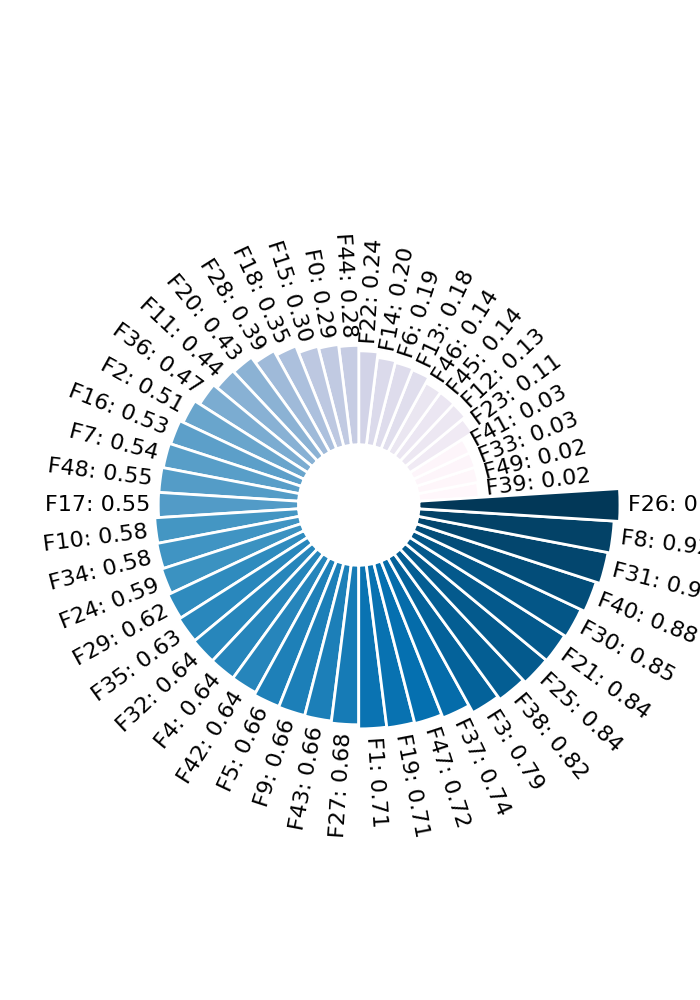
sort values
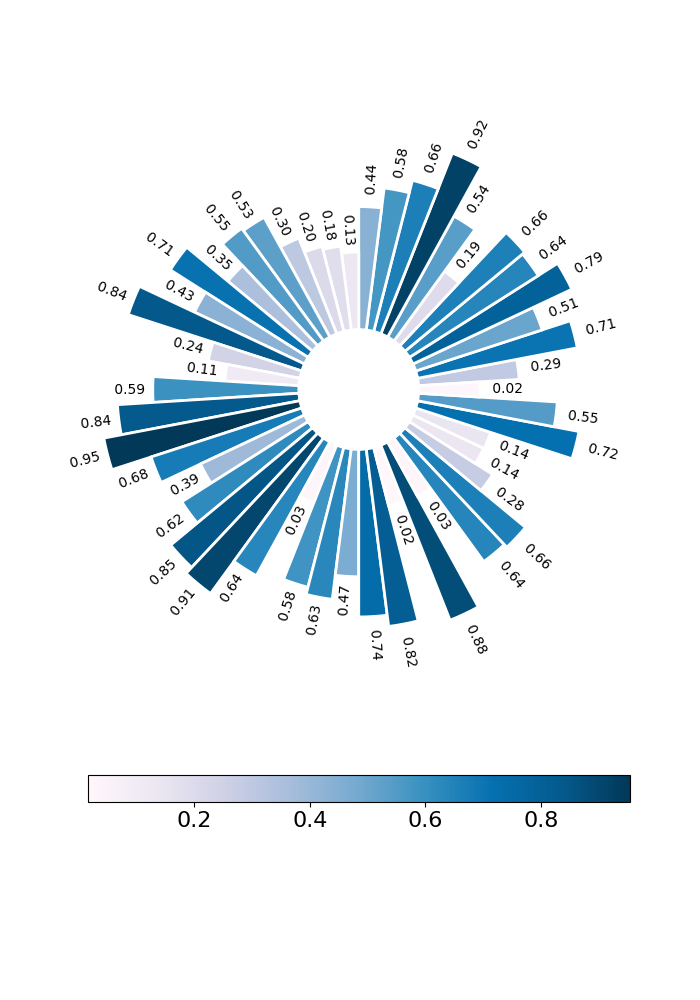
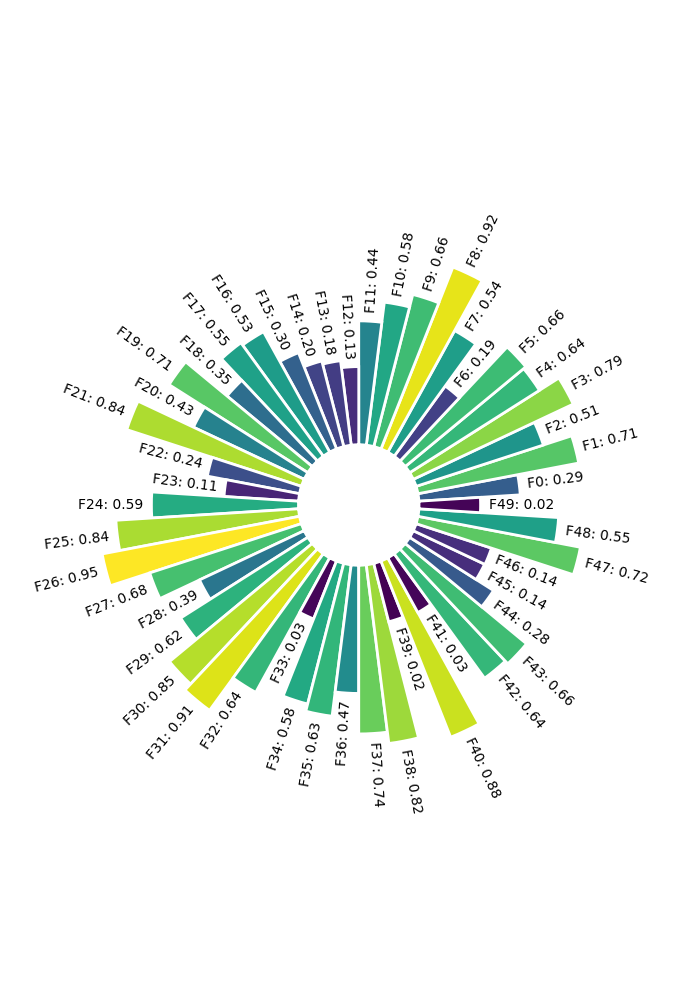
custom color map
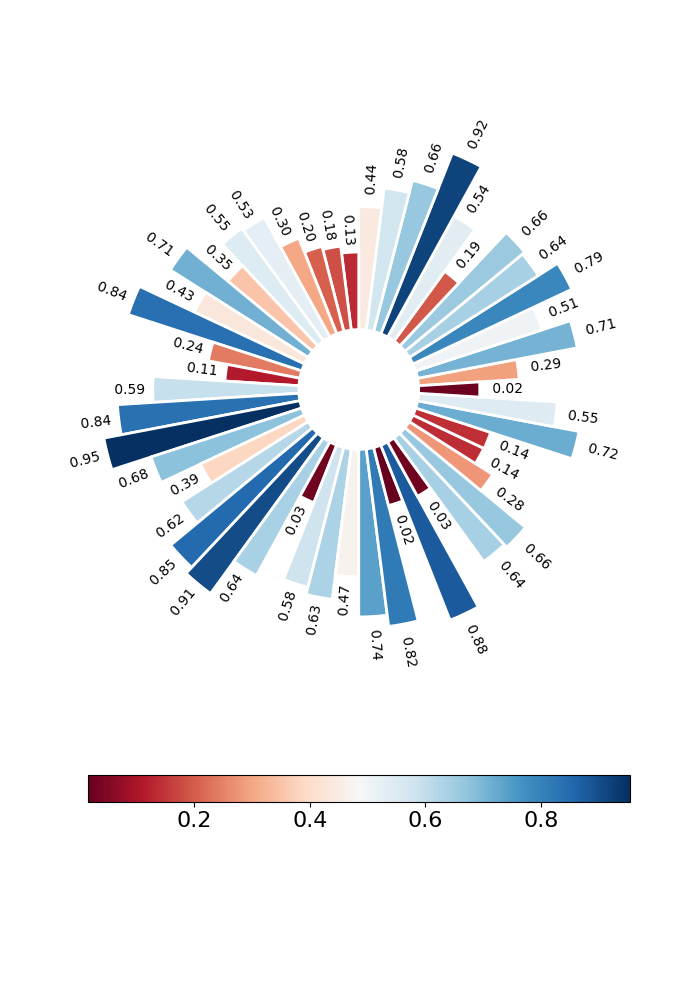
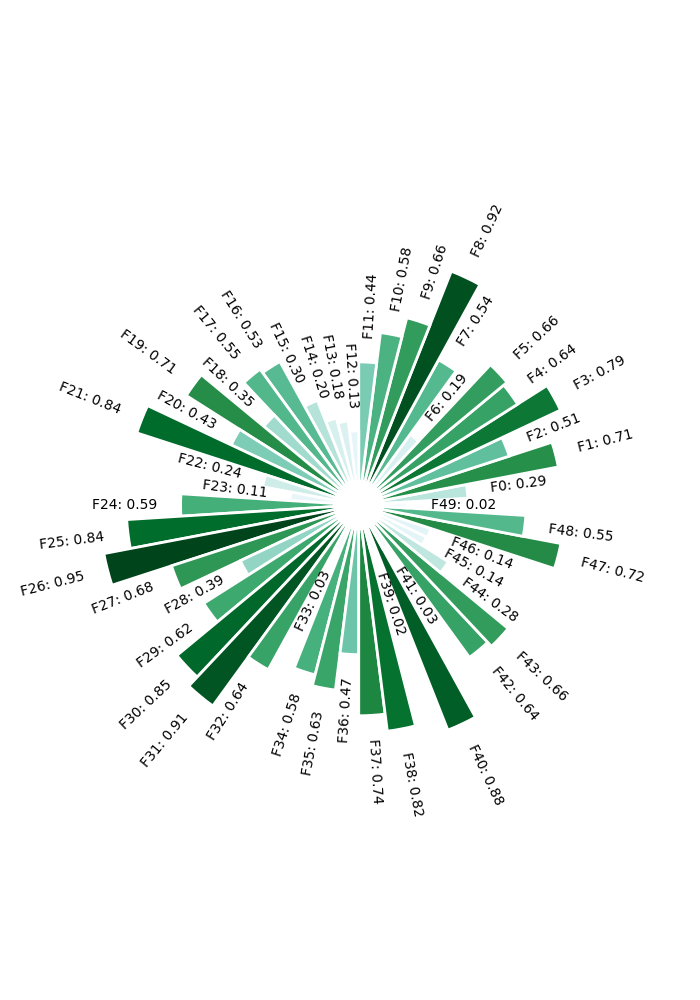
custom min and max range
custom label format
Total running time of the script: (0 minutes 3.656 seconds)