Note
Go to the end to download the full example code. or to run this example in your browser via Binder
g. dumbbell_plot
This file shows the usage of dumbell() function.
# sphinx_gallery_thumbnail_number = -2

import matplotlib.pyplot as plt
import numpy as np
from easy_mpl import dumbbell_plot
from easy_mpl.utils import version_info
from easy_mpl.utils import despine_axes

version_info()
{'easy_mpl': '0.21.5', 'matplotlib': '3.9.4', 'numpy': '2.0.2', 'pandas': '2.2.3', 'scipy': '1.13.1'}
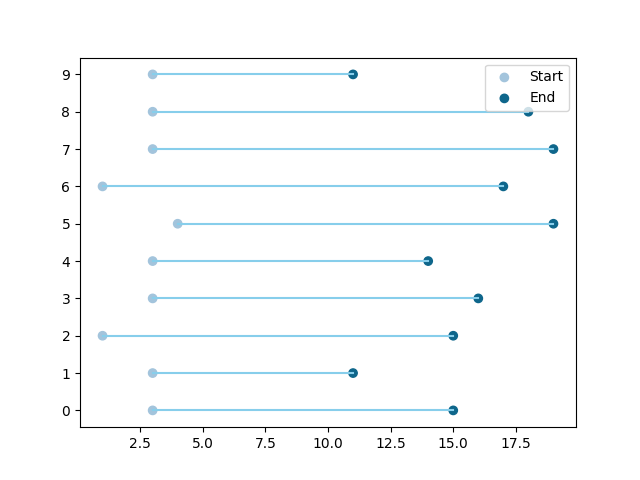
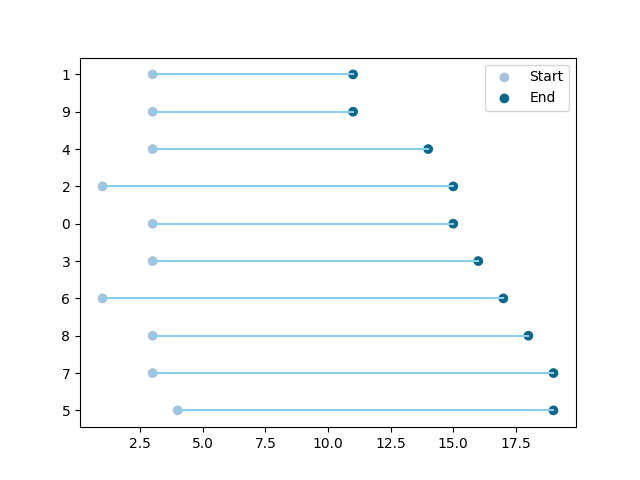
To plot a dumbbell, we require two arrays of equal length.
st = np.random.randint(1, 5, 10)
en = np.random.randint(11, 20, 10)

_ = dumbbell_plot(st, en)
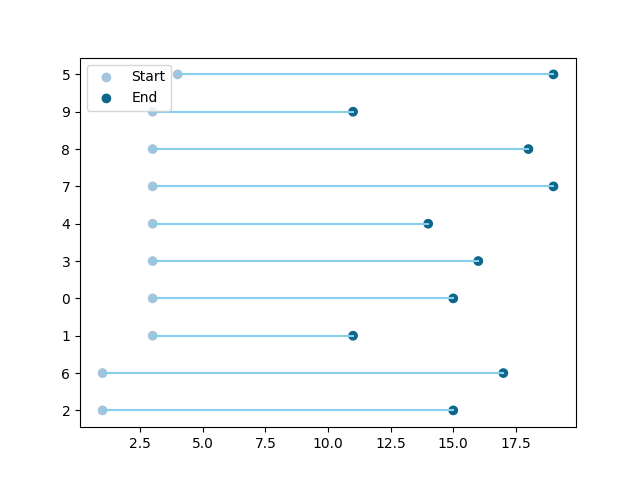
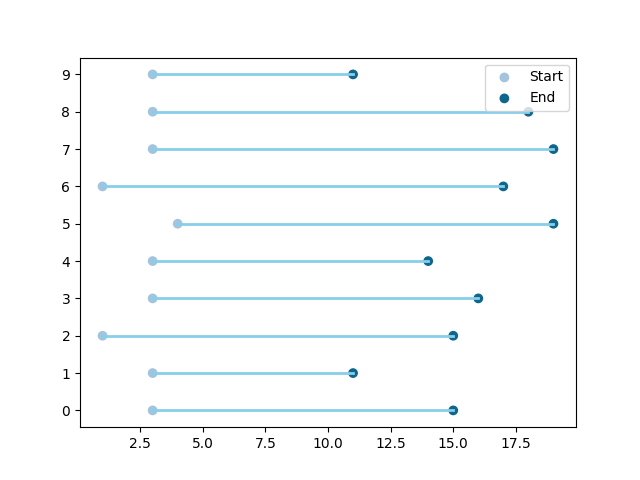
We can sort the dumbbells according the starting value
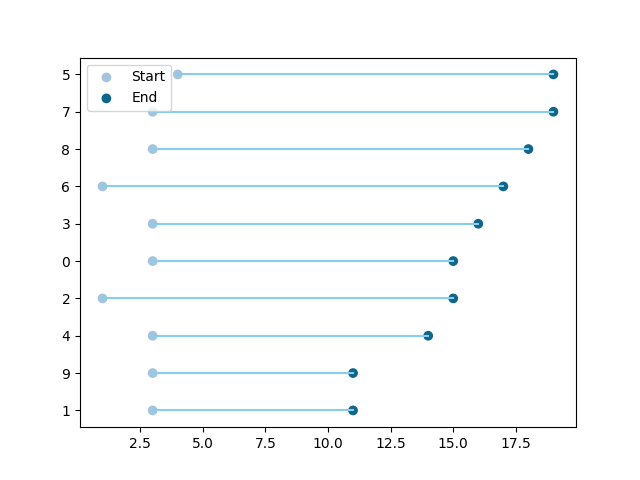
The sorting can also be in descending order
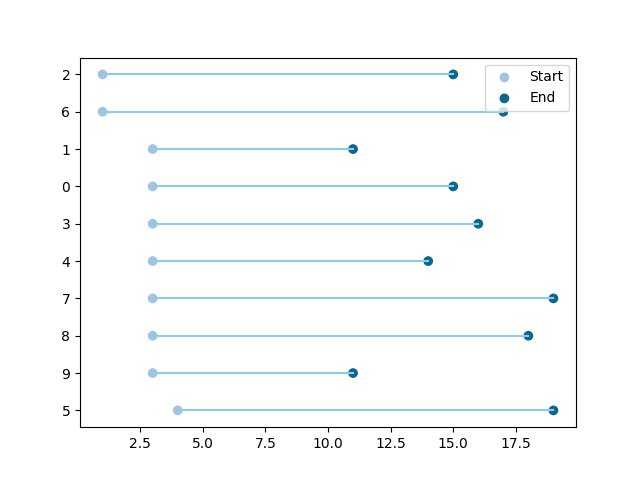
We can also sort dumbbells according to end value
And this can also be in descending order
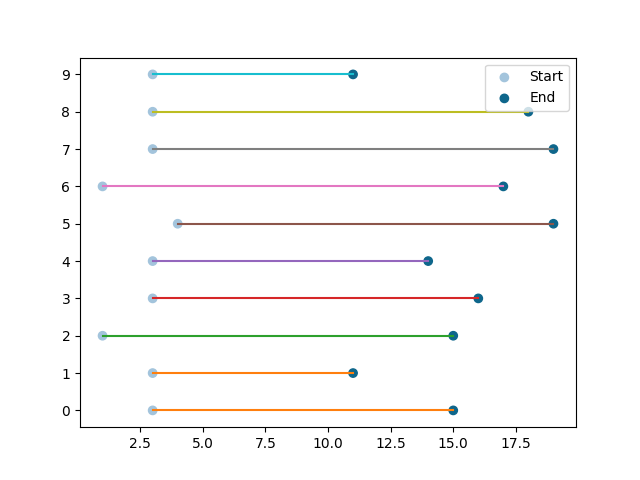
We can also specify the line color using a color palette (color map).
The properties of starting and end markers can be modified by making use
of start_kws and end_kws keyword.
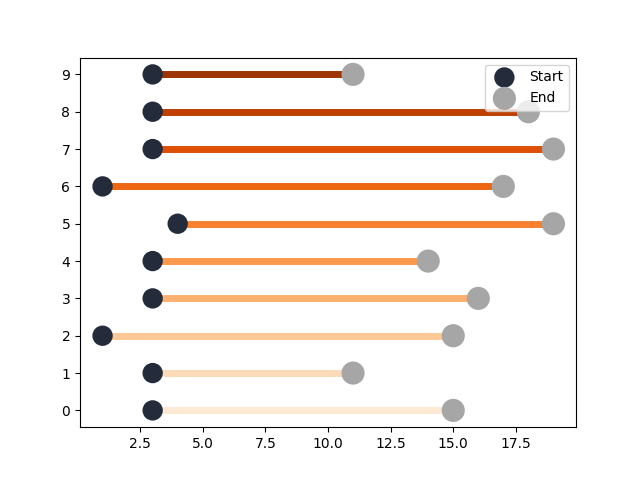
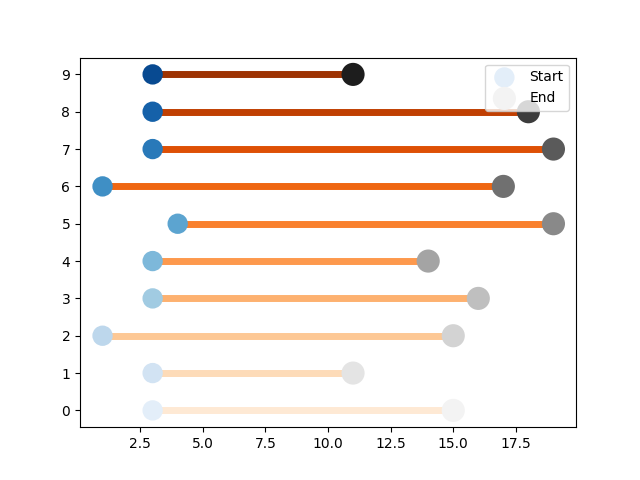
We can also specifiy a separate color for starting markers. One way of doing this is by specifying a palette (colormap) name.
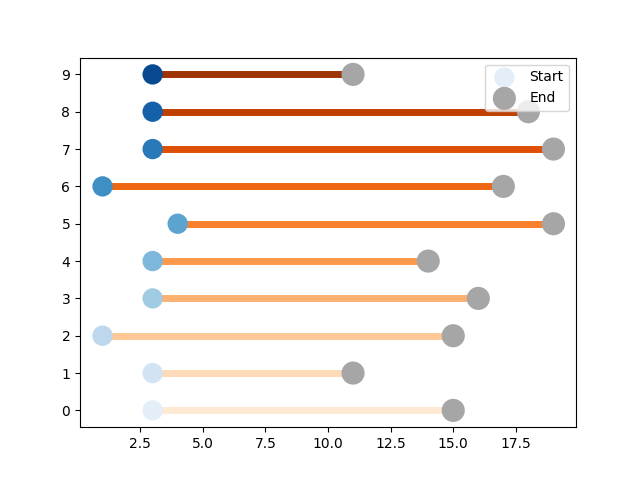
We can also provide colormap for end markers.
_ = dumbbell_plot(
st, en,
line_color="Oranges",
start_marker_color="Blues",
end_marker_color="Greys",
line_kws=dict(lw=5),
start_kws=dict(s=160, lw=2, zorder=2),
end_kws=dict(s=200, lw=2.5, zorder=2)
)
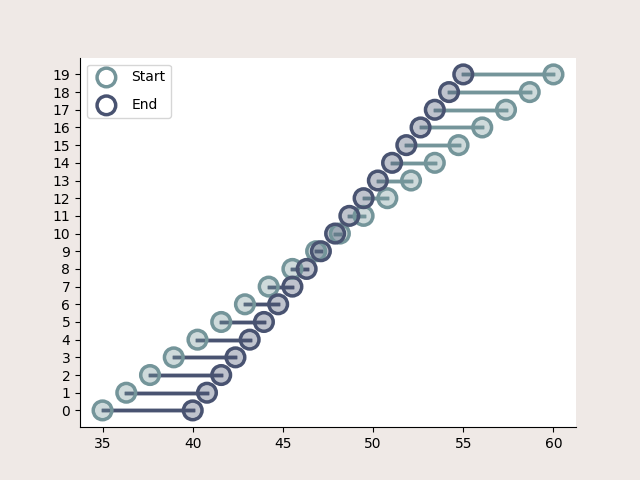
f, ax = plt.subplots(facecolor = "#EFE9E6")
start = np.linspace(35, 60, 20)
end = np.linspace(40, 55, 20)
line_colors = []
for st, en in zip(start, end):
if st>en:
line_colors.append("#74959A")
else:
line_colors.append("#495371")
dumbbell_plot(start, end,
start_kws=dict(color = "#74959A", s = 150, alpha = 0.35, zorder = 3),
end_kws=dict(color = "#495371", s = 150, alpha = 0.35, zorder = 3),
line_kws=dict(zorder = 2, lw = 2.5), line_color=line_colors,
ax=ax,
show=False, )
dumbbell_plot(start, end,
start_kws=dict(color = "none", ec = "#74959A", s = 180, lw = 2.5, zorder = 3),
end_kws=dict(color = "none", ec = "#495371", s = 180, lw = 2.5, zorder = 3),
line_kws=dict(zorder = 2, lw = 2.5), line_color=line_colors,
ax=ax,
show=False )
despine_axes(ax, keep=['left', 'bottom'])
lines, labels = ax.get_legend_handles_labels()
ax.legend([lines[2], lines[3]], ['Start', 'End'], labelspacing=1.0)
plt.show()
Total running time of the script: (0 minutes 1.575 seconds)