Note
Go to the end to download the full example code. or to run this example in your browser via Binder
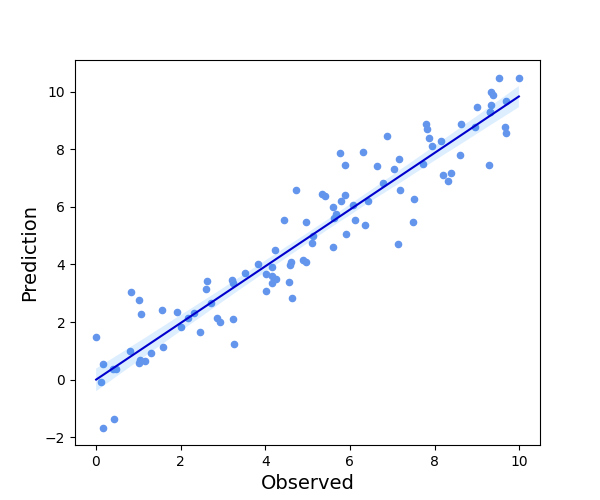
h. regplot
This file shows the usage of regplot() function.
# sphinx_gallery_thumbnail_number = -2

import numpy as np
from easy_mpl import regplot
import matplotlib.pyplot as plt
from easy_mpl.utils import version_info

version_info()
{'easy_mpl': '0.21.5', 'matplotlib': '3.9.4', 'numpy': '2.0.2', 'pandas': '2.2.3', 'scipy': '1.13.1'}
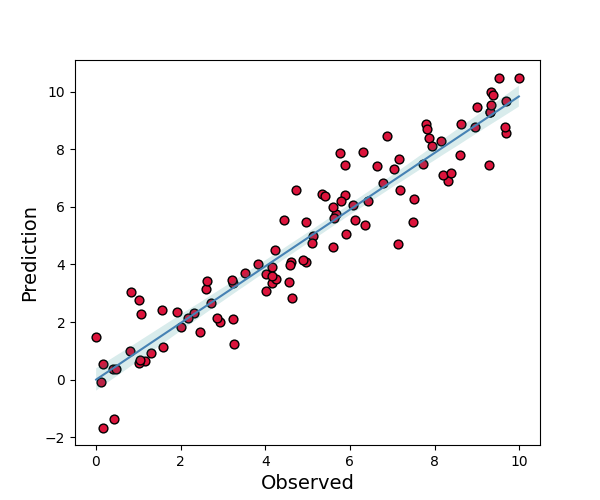
rng = np.random.default_rng(313)

x = rng.uniform(0, 10, size=100)
y = x + rng.normal(size=100)
_ = regplot(x, y)
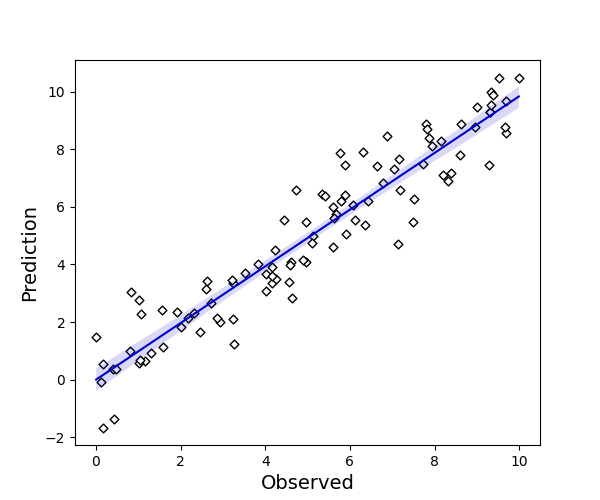
customizing marker style
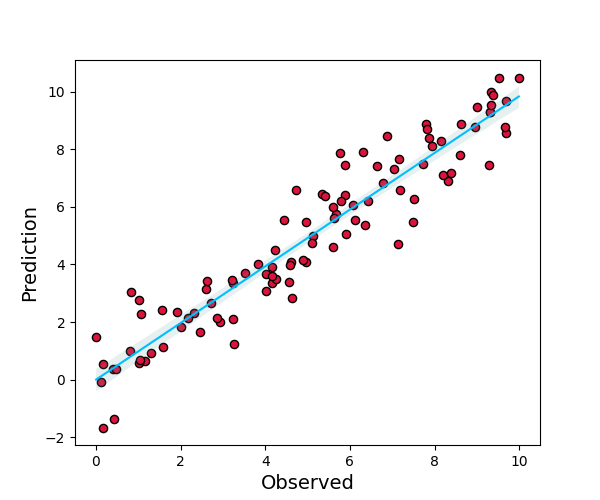
another example by increasing the marker size
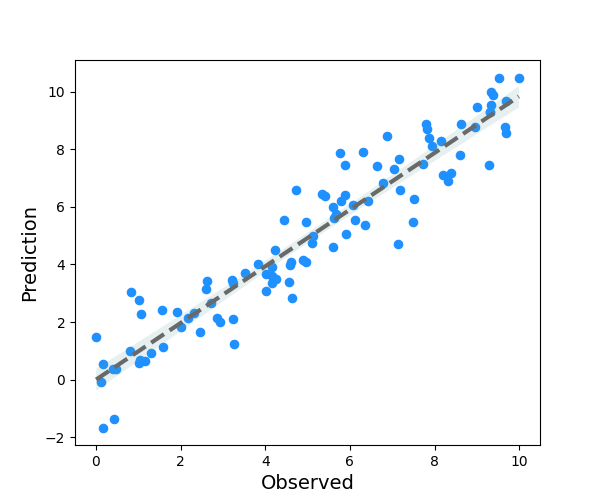
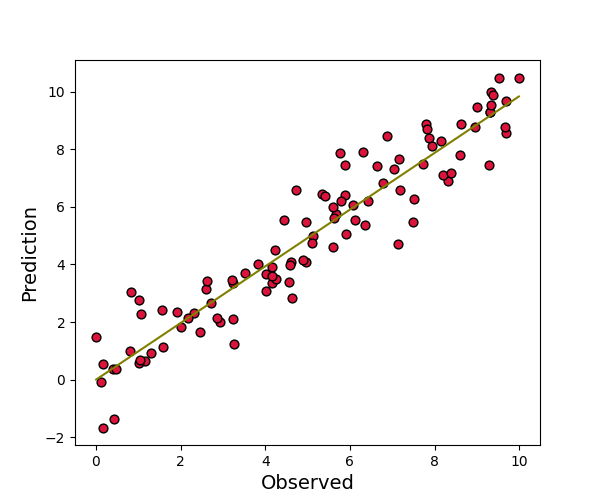
customizing line style
customizing fill color
hiding confidence interval
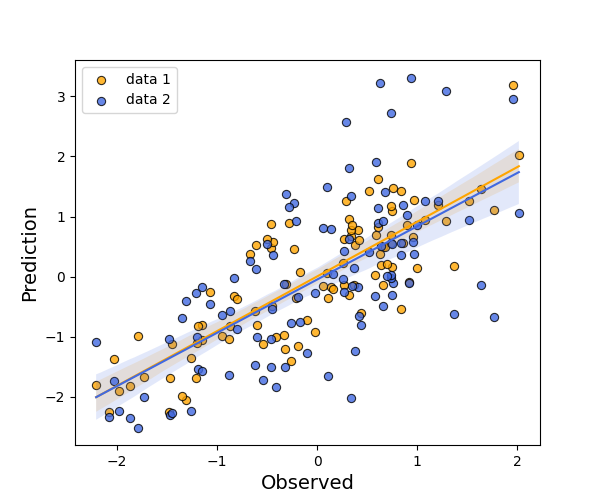
multiple regression lines with customized marker, line and fill style
cov = np.array(
    [[1.0, 0.9, 0.7],
     [0.9, 1.2, 0.8],
     [0.7, 0.8, 1.4]]
)
data = rng.multivariate_normal(np.zeros(3),
                               cov, size=100)

ax = regplot(data[:, 0], data[:, 1], line_color='orange',
             marker_color='orange', marker_size=35, fill_color='orange',
             scatter_kws={'edgecolors':'black', 'linewidth':0.8, 'alpha': 0.8},
             show=False, label="data 1")
_ = regplot(data[:, 0], data[:, 2], line_color='royalblue', ax=ax,
                marker_color='royalblue', marker_size=35, fill_color='royalblue',
             scatter_kws={'edgecolors':'black', 'linewidth':0.8, 'alpha': 0.8},
             show=False, label="data 2", ax_kws=dict(legend_kws=dict(loc=(0.1, 0.8))))
plt.show()
Total running time of the script: (0 minutes 1.494 seconds)