Note
Go to the end to download the full example code. or to run this example in your browser via Binder
m. parallel_coordinates
This file shows the usage of parallel_coordinates() function.
import random

import matplotlib.pyplot as plt
import numpy as np
import pandas as pd
from easy_mpl import parallel_coordinates
from easy_mpl.utils import version_info

version_info()
{'easy_mpl': '0.21.5', 'matplotlib': '3.9.4', 'numpy': '2.0.2', 'pandas': '2.2.3', 'scipy': '1.13.1'}
ynames = ['P1', 'P2', 'P3', 'P4', 'P5'] # feature/column names
N1, N2, N3 = 10, 5, 8
N = N1 + N2 + N3
categories_ = ['a', 'b', 'c', 'd', 'e', 'f']
y1 = np.random.uniform(0, 10, N) + 7
y2 = np.sin(np.random.uniform(0, np.pi, N))
y3 = np.random.binomial(300, 1 / 10, N)
y4 = np.random.binomial(200, 1 / 3, N)
y5 = np.random.uniform(0, 800, N)
# combine all arrays into a pandas DataFrame
data_np = np.column_stack((y1, y2, y3, y4, y5))
data_df = pd.DataFrame(data_np, columns=ynames)
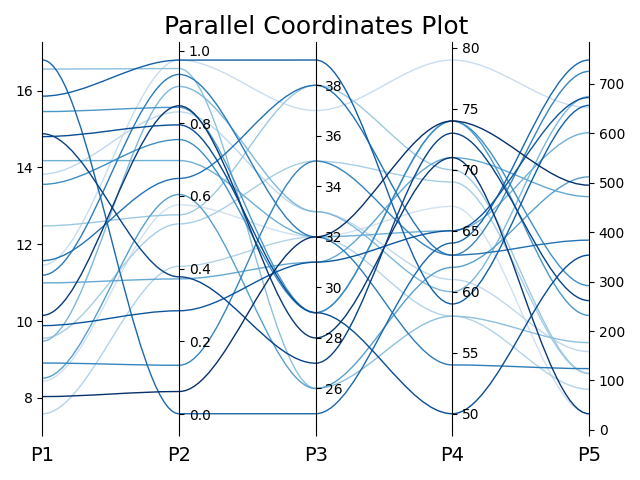
# using a DataFrame to draw parallel coordinates
_ = parallel_coordinates(data_df, names=ynames)
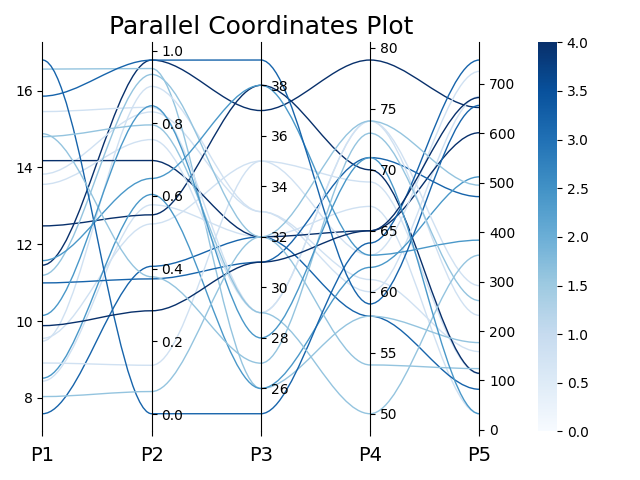
using continuous values for categories
_ = parallel_coordinates(data_df, names=ynames, categories=np.random.randint(0, 5, N))
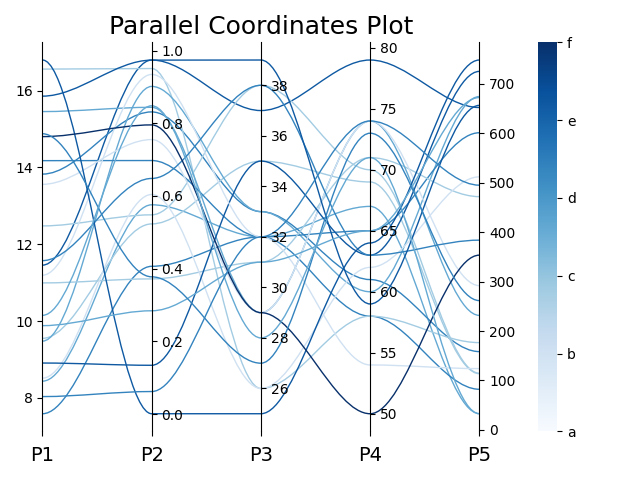
using categorical classes
_ = parallel_coordinates(data_df, names=ynames, categories=random.choices(categories_, k=N))
using numpy array instead of DataFrame
_ = parallel_coordinates(data_df.values, names=ynames)

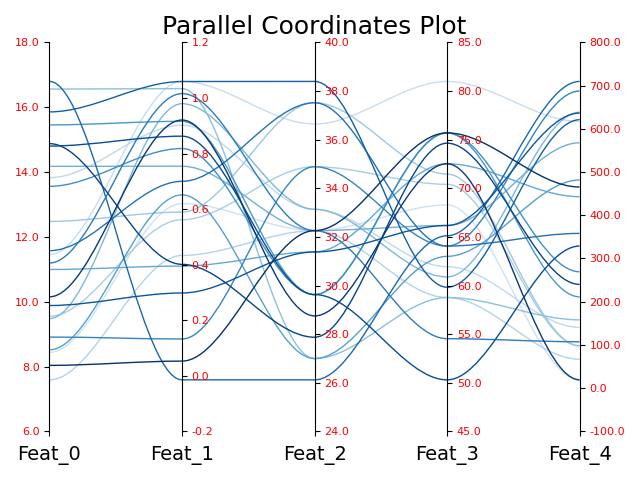
with customized tick labels
_ = parallel_coordinates(data_df.values, ticklabel_kws={"fontsize": 8, "color": "red"})
using straight lines instead of bezier
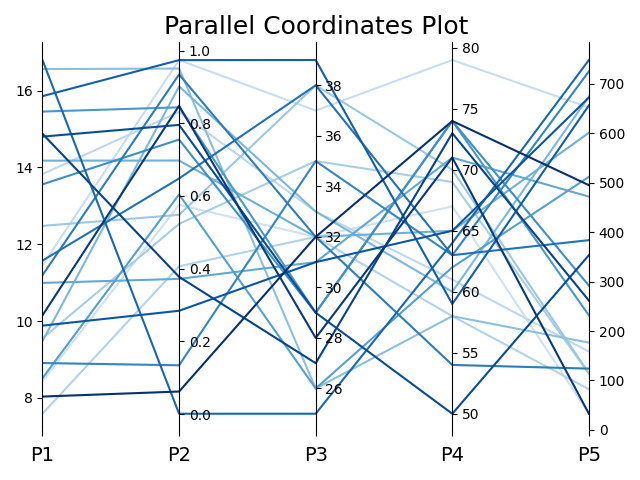
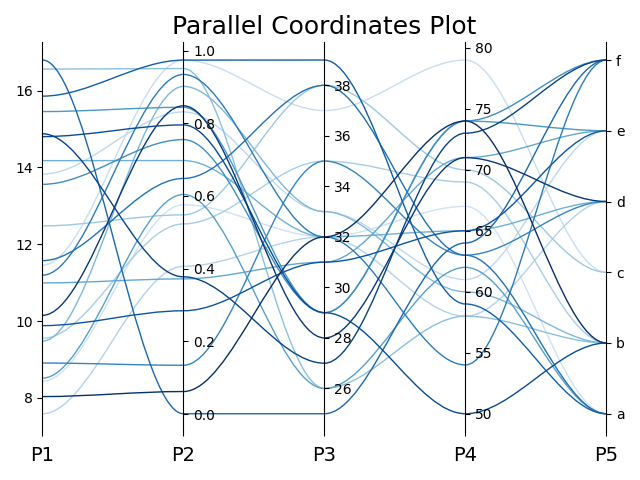
with categorical class labels
data_df['P5'] = random.choices(categories_, k=N)
_ = parallel_coordinates(data_df, names=ynames)
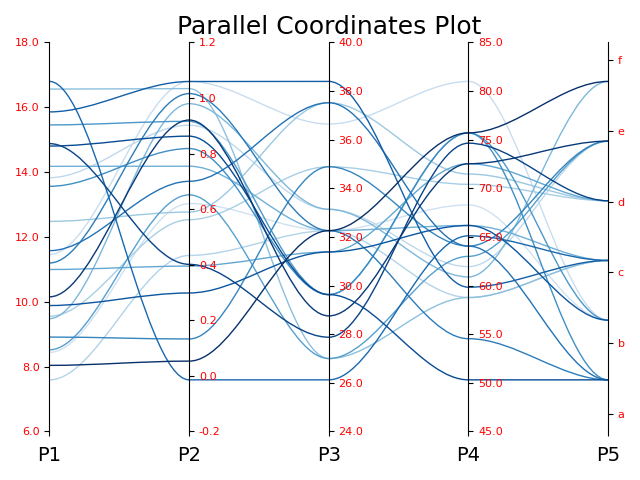
with categorical class labels and customized ticklabels
data_df['P5'] = random.choices(categories_, k=N)
_ = parallel_coordinates(data_df,  ticklabel_kws={"fontsize": 8, "color": "red"})
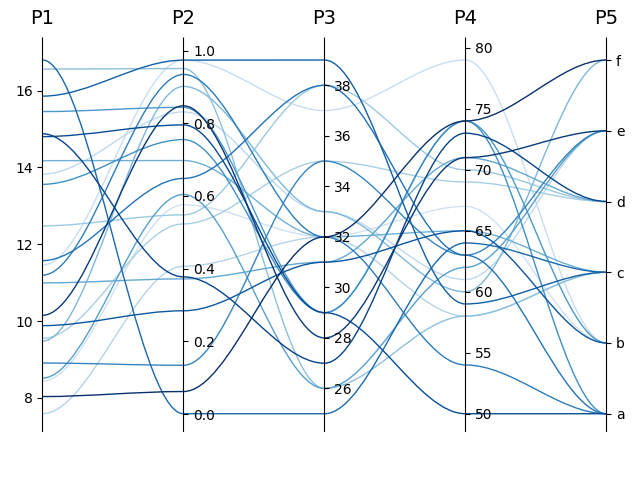
show parameter labels at the top
axes = parallel_coordinates(data_df, show=False)
axes.xaxis.tick_top()
plt.show()
Total running time of the script: (0 minutes 5.246 seconds)