Note
Go to the end to download the full example code. or to run this example in your browser via Binder
f. lollipop_plot
This file shows the usage of lollipop_plot() function.
# sphinx_gallery_thumbnail_number = -1

import matplotlib.pyplot as plt
import numpy as np
from easy_mpl import lollipop_plot
from easy_mpl.utils import version_info

version_info()
{'easy_mpl': '0.21.5', 'matplotlib': '3.9.4', 'numpy': '2.0.2', 'pandas': '2.2.3', 'scipy': '1.13.1'}
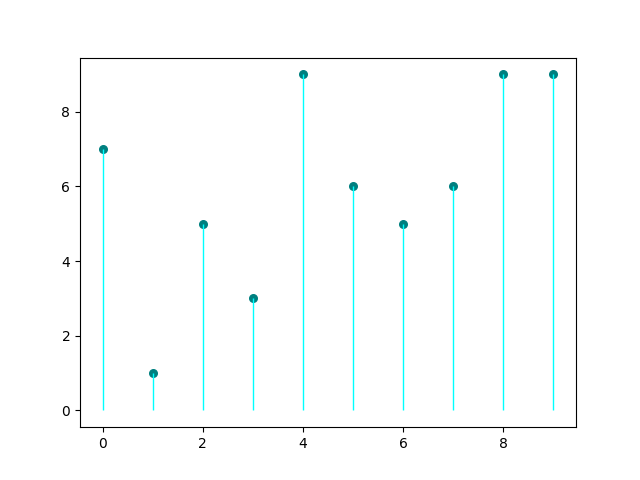
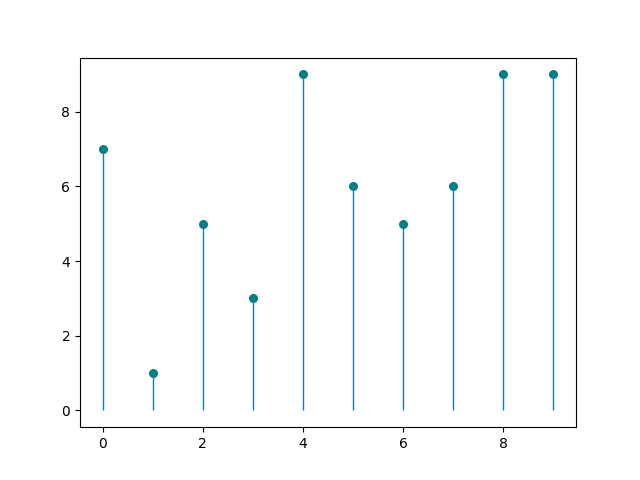
To draw a lollipop we need an array or a list of numeric values
y = np.random.randint(1, 10, size=10)

_ = lollipop_plot(y, title="vanilla")
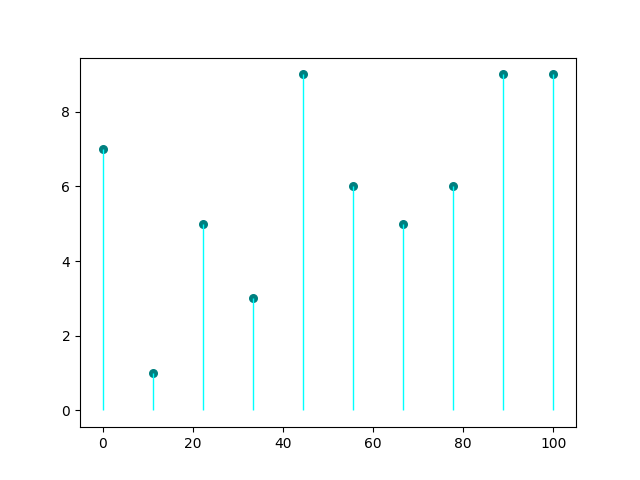
We can also specify the x coordinates for our data as second argument
_ = lollipop_plot(y, np.linspace(0, 100, len(y)), title="with x and y")
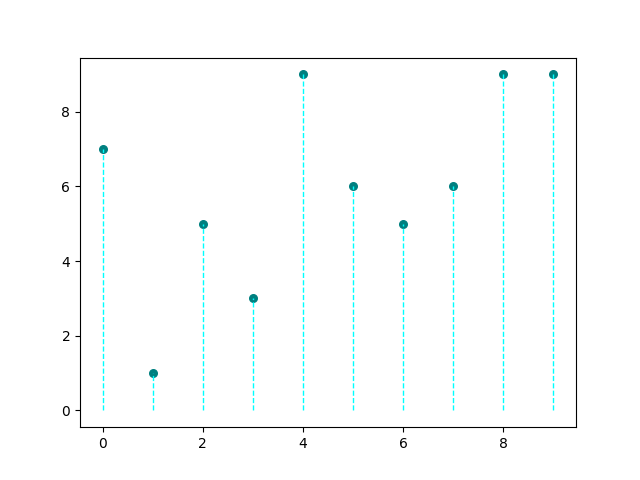
line style can be set using line_style argument.
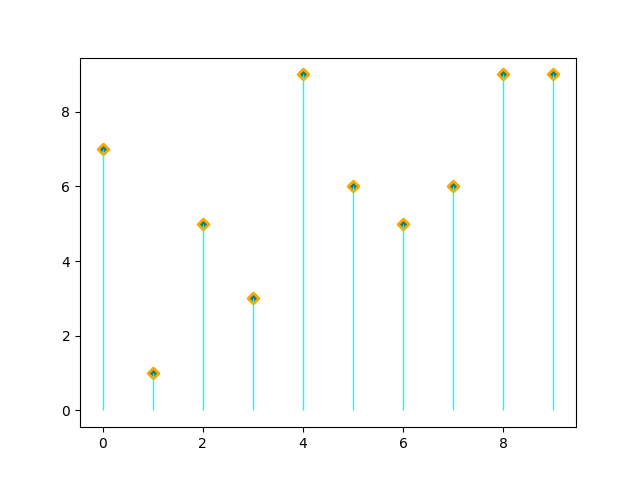
Similarly marker style can be set using marker_style argument.
the line color can also be a matplotlib colormap name
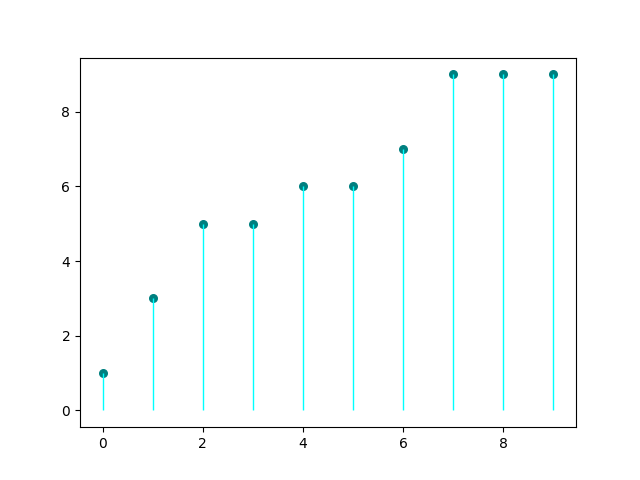
We can sort the lollipops by setting the sort to True
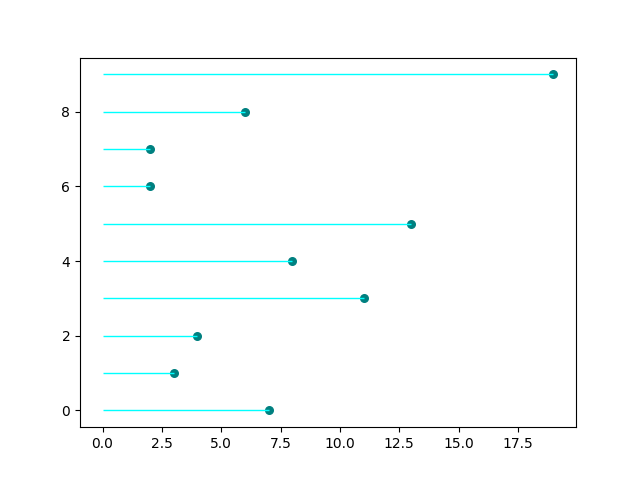
The orientation of lollipops can be made horizontal
y = np.random.randint(0, 20, size=10)
_ = lollipop_plot(y, orientation="horizontal", title="horizontal")
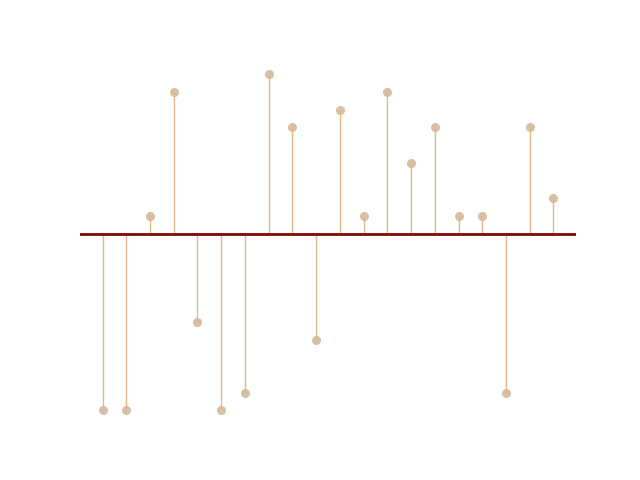
The lollipop plot returns matplotlib axes object which can be used for further manipulation of axes.
y = np.random.randint(-10, 10, 20)
y[y==0] = 1
ax = lollipop_plot(y, marker_color="#D7BFA6",
                   line_color="burlywood",
                   show=False)
ax.axhline(0.0, lw=2.0, color='maroon')
ax.axis('off')
plt.show()
Total running time of the script: (0 minutes 0.812 seconds)